Logging System
Production-ready logging with 11 phases.
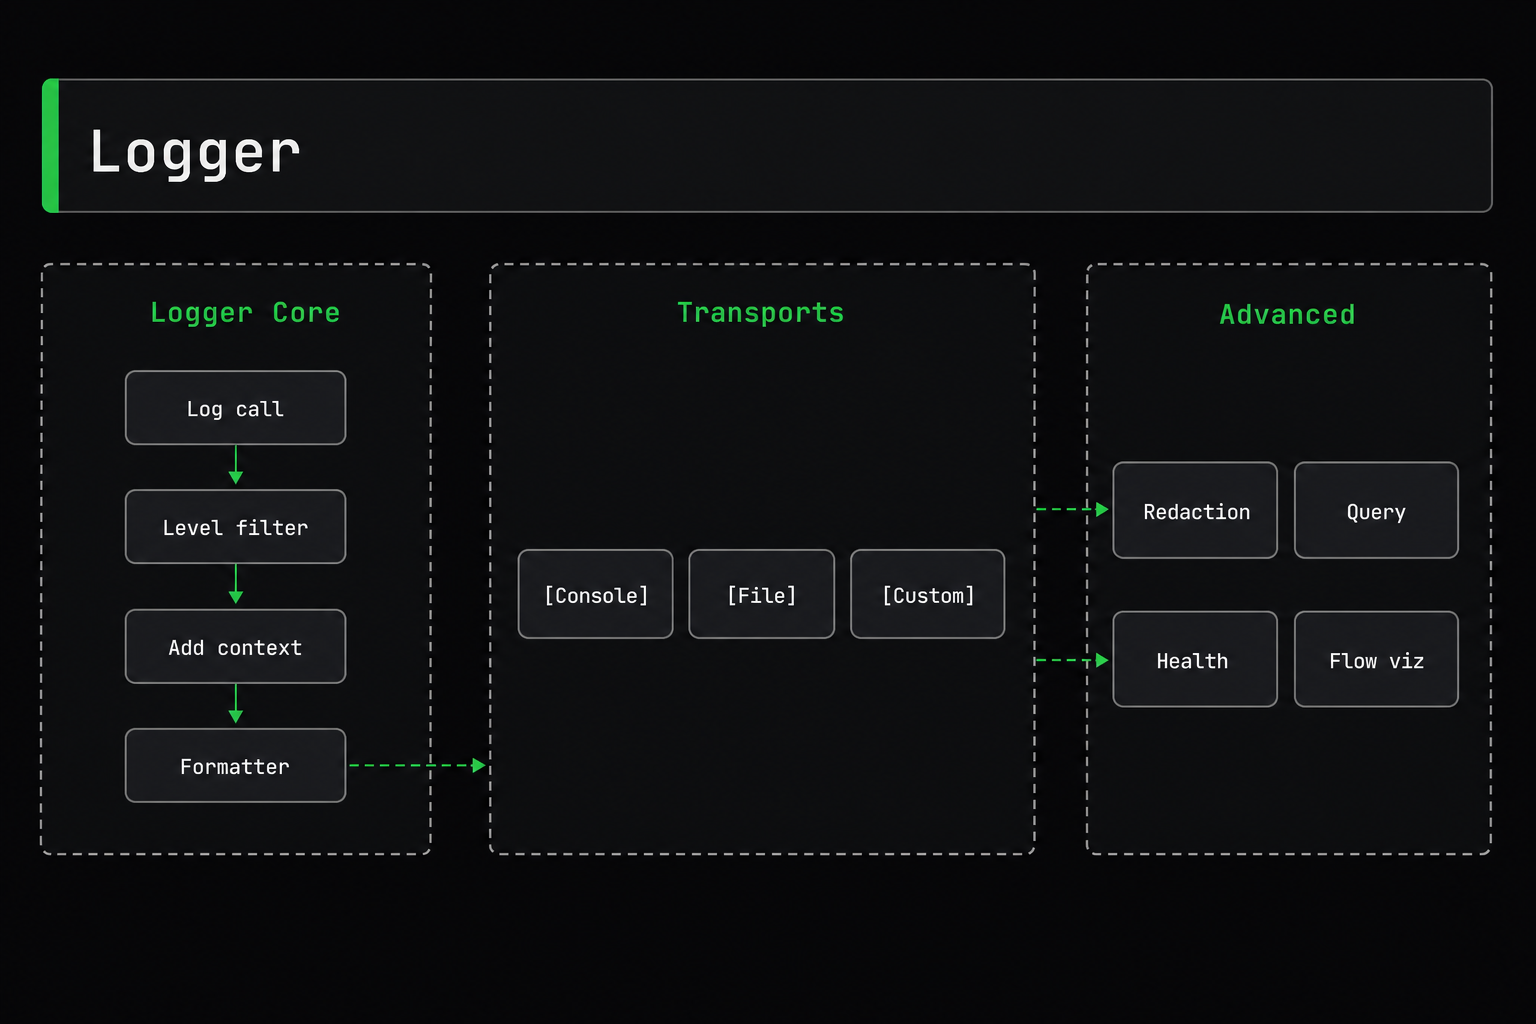
Overview
| Feature | Description |
|---|---|
| Log Levels | TRACE, DEBUG, INFO, WARN, ERROR, FATAL |
| Structured Logging | Objects with full metadata |
| Transports | Console, File, Custom |
| Context Management | Child loggers and context tracking |
| Data Redaction | Automatic sensitive data protection |
| Performance Tracking | Built-in metrics |
| Query & Export | In-memory buffer with search |
| Flow Visualization | Event flow tracking |
| Error Suggestions | Helpful hints for common errors |
| Health Monitoring | CPU, memory, system health |
Quick Start
Basic Usage
import { provide, inject, Logger } from "@expressots/core";

@provide(MyService)
export class MyService {
    constructor(@inject(Logger) private logger: Logger) {}

    doSomething() {
        this.logger.info("User created", { userId: 123 });
        this.logger.warn("Cache miss", { key: "user:123" });
        this.logger.error("Database error", new Error("Connection failed"));
    }
}
Registration
Register logger in your application:
export class App extends AppExpress {
    async configureServices(): Promise<void> {
        // Register Logger as Singleton
        this.Provider.register(Logger, Scope.Singleton);
    }
}
Log Levels
Six log levels with intelligent filtering:
| Level | Value | Use Case | Example |
|---|---|---|---|
| TRACE | 0 | Ultra-detailed debug info | Function entry/exit, variable values |
| DEBUG | 1 | Detailed diagnostic information | Processing steps, state changes |
| INFO | 2 | General information | User actions, system events |
| WARN | 3 | Warning messages | Deprecated API usage, potential issues |
| ERROR | 4 | Error messages | Handled exceptions, failed operations |
| FATAL | 5 | Fatal errors | Unrecoverable errors, system crashes |
Using Log Levels
// All log levels
this.logger.trace("Ultra detailed debug info");
this.logger.debug("Detailed diagnostic info");
this.logger.info("General information");
this.logger.warn("Warning message");
this.logger.error("Error message");
this.logger.fatal("Fatal error");
Filtering by Level
Only logs at or above the configured level are output:
import { Logger, LogLevel } from "@expressots/core";

// Set minimum level to INFO
this.logger.configure({ level: LogLevel.INFO });

this.logger.trace("Not shown"); // Below INFO
this.logger.debug("Not shown"); // Below INFO
this.logger.info("Shown");      // INFO and above
this.logger.warn("Shown");      // Above INFO
this.logger.error("Shown");     // Above INFO
Structured Logging
Log complex data with full TypeScript support:
Basic Structured Data
this.logger.info("User created", {
userId: 123,
plan: "premium",
timestamp: new Date()
});
With Context
this.logger.info("Order processed", "OrderService", {
    orderId: 456,
    total: 99.99,
    items: 3,
    paymentMethod: "credit_card"
});
Error Objects
try {
    await database.connect();
} catch (error) {
    this.logger.error(
        "Database connection failed",
        "DatabaseService",
        error as Error
    );
}
Output (Development):
[ExpressoTS] 2026-01-10 10:30:45 [PID:12345] ERROR [DatabaseService] Database connection failed
  ├─ error: Error: Connection timeout
  └─ stack:
     at Database.connect (database.ts:42:15)
     at DatabaseService.initialize (service.ts:18:30)
Context Management
Using withContext()
Temporarily set context for a single log:
this.logger.withContext("PaymentService").info("Processing payment");
// [ExpressoTS] ... INFO [PaymentService] Processing payment

this.logger.withContext("EmailService").debug("Sending welcome email");
// [ExpressoTS] ... DEBUG [EmailService] Sending welcome email
Child Loggers
Create a child logger with persistent context:
export class UserService {
    private serviceLogger: Logger;

    constructor(@inject(Logger) private logger: Logger) {
        // Create child with permanent context
        this.serviceLogger = logger.child("UserService");
    }

    createUser(data: CreateUserDto) {
        this.serviceLogger.info("Creating user", { email: data.email });
        this.serviceLogger.debug("Validating user data");
        this.serviceLogger.info("User created successfully", { userId: 123 });
    }
}
Transport System
Transports control log destinations.
Console Transport
Development Format (Pretty, Colored)
import { Logger, ConsoleTransport } from "@expressots/core";

this.logger.configure({
    transports: [ConsoleTransport.forDevelopment()]
});
Output:
[ExpressoTS] 2026-01-10 10:30:45 [PID:12345] INFO  [UserService] User created
  ├─ userId: 123
  ├─ email: "[email protected]"
  └─ plan: "premium"
Production Format (JSON)
this.logger.configure({
    transports: [ConsoleTransport.forProduction()]
});
Output:
{"timestamp":"2026-01-10T10:30:45.123Z","level":"INFO","context":"UserService","message":"User created","data":{"userId":123,"email":"[email protected]","plan":"premium"}}
File Transport
Daily Rotating Files
import { Logger, FileTransport } from "@expressots/core";

this.logger.configure({
    transports: [
        ConsoleTransport.forDevelopment(),
        FileTransport.daily({
            directory: "logs",
            filename: "app" // Creates app-YYYY-MM-DD.log
        })
    ]
});
Size-Based Rotation
FileTransport.rotating({
    directory: "logs",
    filename: "app.log",
    maxSize: "10m",     // Rotate at 10MB
    maxFiles: 5         // Keep 5 files
})
Fixed Filename
FileTransport.fixed({
    directory: "logs",
    filename: "application.log"
})
Custom Transports
Create custom transports for databases, external services, etc.:
import { Transport, LogEntry } from "@expressots/core";

class DatabaseTransport implements Transport {
    async write(entry: LogEntry): Promise<void> {
        await database.logs.insert({
            level: entry.level,
            message: entry.message,
            context: entry.context,
            timestamp: entry.timestamp,
            data: entry.data
        });
    }
}

// Use it
this.logger.configure({
    transports: [
        ConsoleTransport.forDevelopment(),
        new DatabaseTransport()
    ]
});
Multiple Transports
Log to multiple destinations simultaneously:
this.logger.configure({
    transports: [
        ConsoleTransport.forDevelopment(),
        FileTransport.daily({ directory: "logs" }),
        FileTransport.fixed({
            directory: "logs/errors",
            filename: "errors.log",
            level: LogLevel.ERROR  // Only errors
        }),
        new DatabaseTransport(),
        new CloudWatchTransport()
    ]
});
Configuration
Complete Configuration
import { Logger, LogLevel, ConsoleTransport, FileTransport } from "@expressots/core";

const appLogger = this.Provider.get(Logger);

appLogger.configure({
    // Minimum log level
    level: LogLevel.DEBUG,

    // Transports (where to write logs)
    transports: [
        ConsoleTransport.forDevelopment(),
        FileTransport.daily({ directory: "logs" })
    ],

    // Error suggestions (Phase 8)
    suggestions: {
        enabled: true,
        showRouteSuggestions: true,
        showErrorHints: true,
        maxRouteSuggestions: 3,
        minSimilarityThreshold: 0.3
    },

    // Flow visualization (Phase 7)
    flow: {
        enabled: true,
        showVisualization: true,
        trackMemory: true,
        trackNested: true
    },

    // Health monitoring (Phase 9)
    health: {
        enabled: true,
        interval: 30000,          // Check every 30s
        memoryThreshold: 80,       // Alert at 80% memory
        cpuThreshold: 90,          // Alert at 90% CPU
        alertsEnabled: true
    },

    // Query & export (Phase 11)
    query: {
        enabled: true,
        bufferSize: 1000,          // Keep last 1000 logs
        enableExport: true
    },

    // Performance tracking (Phase 5)
    performance: {
        enabled: true,
        slowThreshold: 1000        // Warn if operation > 1s
    },

    // Redaction (Phase 4)
    redaction: {
        enabled: true,
        partialRedaction: true,
        revealLastChars: 4
    }
});
Environment-Based Configuration
const isDevelopment = process.env.NODE_ENV !== "production";

this.logger.configure({
    level: isDevelopment ? LogLevel.DEBUG : LogLevel.WARN,
    transports: [
        isDevelopment
            ? ConsoleTransport.forDevelopment()
            : ConsoleTransport.forProduction(),
        ...(isDevelopment ? [] : [FileTransport.daily({ directory: "logs" })])
    ],
    suggestions: { enabled: isDevelopment },
    flow: { enabled: isDevelopment },
    health: { enabled: !isDevelopment },
    query: { enabled: isDevelopment }
});
Sensitive Data Redaction
Automatically redact sensitive data (passwords, API keys, credit cards).
Automatic Redaction
Redaction is enabled by default in production:
this.logger.info("User login", {
password: "secret123", // Automatically redacted
apiKey: "sk_live_abc123", // Automatically redacted
creditCard: "4532015112830366" // Automatically redacted
});
Output:
email: "[email protected]"
password: "••••••••"
apiKey: "••••••••"
creditCard: "••••••••"
Partial Redaction
Show last N characters:
import { configureGlobalRedactor } from "@expressots/core";

configureGlobalRedactor({
    enabled: true,
    partialRedaction: true,
    revealLastChars: 4
});

this.logger.info("Payment processed", {
    creditCard: "4532015112830366"  // Shows last 4 digits
});
// creditCard: "••••••••••••0366"
Default Patterns
Field Patterns (40+ patterns):
password,passwd,pwdsecret,apiKey,api_keytoken,accessToken,refreshTokencreditCard,cardNumber,cvvssn,socialSecurity- And 30+ more...
Regex Patterns (9 patterns):
- Credit cards:
/^\d{4}[\s-]?\d{4}[\s-]?\d{4}[\s-]?\d{4}$/ - SSN:
/^\d{3}-\d{2}-\d{4}$/ - AWS keys:
/^AKIA[0-9A-Z]{16}$/ - JWT tokens:
/^eyJ[a-zA-Z0-9_-]+\./ - Stripe keys:
/^sk_live_[a-zA-Z0-9]{24,}$/ - And more...
Custom Patterns
Add your own sensitive fields:
configureGlobalRedactor({
    enabled: true,
    customFieldPatterns: [
        "internalCode",
        "employeeId",
        "companySecret"
    ],
    customRegexPatterns: [
        {
            name: "custom_id",
            pattern: /^CUST-\d{8}$/,
            replacement: "CUST-••••••••"
        }
    ]
});
Whitelist
Prevent redaction of specific fields:
configureGlobalRedactor({
    enabled: true,
    whitelist: [
        "password_reset_token_expires",  // Won't be redacted
        "api_version"                     // Won't be redacted
    ]
});
Per-Transport Configuration
Different redaction for different transports:
this.logger.configure({
    transports: [
        ConsoleTransport.forDevelopment({
            redaction: { enabled: false }  // No redaction in dev console
        }),
        FileTransport.daily({
            directory: "logs",
            redaction: { enabled: true }   // Redaction in files
        })
    ]
});
Performance Monitoring
Track operation duration and metrics:
Basic Performance Tracking
this.logger.withPerformance("Database Query", async () => {
    return await database.users.findMany();
});
// Logs: "Database Query completed in 45ms"
Manual Timing
const start = Date.now();

// Your operation
await processData();

this.logger.info("Operation completed", {
    duration: Date.now() - start
});
Slow Operation Warnings
this.logger.configure({
    performance: {
        enabled: true,
        slowThreshold: 1000  // Warn if > 1 second
    }
});

// Automatically warns if slow
await this.logger.withPerformance("Heavy Operation", async () => {
    return await heavyComputation();
});
// ⚠️ WARNING: "Heavy Operation completed in 2500ms (slow)"
Log Grouping
Group related logs:
this.logger.group("User Registration Flow", () => {
    this.logger.info("Validating user data");
    this.logger.debug("Checking email uniqueness");
    this.logger.info("Creating user record");
    this.logger.info("Sending welcome email");
});
Output:
┌─ User Registration Flow
│  INFO  Validating user data
│  DEBUG Checking email uniqueness
│  INFO  Creating user record
│  INFO  Sending welcome email
└─ User Registration Flow (completed in 150ms)
Nested Groups
this.logger.group("Order Processing", () => {
    this.logger.info("Validating order");

    this.logger.group("Payment Processing", () => {
        this.logger.debug("Checking payment method");
        this.logger.info("Charging credit card");
    });

    this.logger.info("Order confirmed");
});
Flow Visualization
Visualize event flow:
Enable Flow Tracking
this.logger.configure({
    flow: {
        enabled: true,
        showVisualization: true,
        trackMemory: true,
        trackNested: true
    }
});
Automatic Visualization
When events are emitted, see the flow:
UserCreatedEvent
├�── SendWelcomeEmailHandler (12ms)
├── CreateUserProfileHandler (8ms)
├── LogAnalyticsHandler (2ms)
└── NotifyAdminHandler (5ms)
Total: 27ms
Access Flow Data
const flowData = this.logger.getFlowData(requestId);
console.log(flowData.events);
console.log(flowData.handlers);
console.log(flowData.totalDuration);
Error Suggestions
Helpful suggestions for common errors:
Route Suggestions
When a 404 occurs:
❌ Route not found: GET /api/usr/profile

💡 Did you mean one of these?
   - GET /api/user/profile (similarity: 0.91)
   - GET /api/users/profile (similarity: 0.85)
   - GET /api/user/preferences (similarity: 0.72)
Error Hints
Helpful hints for common errors:
❌ Database connection failed

💡 Common causes:
   - Check DATABASE_URL environment variable
   - Verify database is running
   - Check network connectivity
   - Verify credentials are correct
Configuration
this.logger.configure({
    suggestions: {
        enabled: true,
        showRouteSuggestions: true,
        showErrorHints: true,
        maxRouteSuggestions: 3,
        minSimilarityThreshold: 0.3
    }
});
Health Monitoring
Continuous system health monitoring:
Enable Health Monitoring
this.logger.configure({
    health: {
        enabled: true,
        interval: 30000,          // Check every 30 seconds
        memoryThreshold: 80,       // Alert at 80% memory usage
        cpuThreshold: 90,          // Alert at 90% CPU usage
        alertsEnabled: true,
        logLevel: "info",
        alertLogLevel: "warn"
    }
});
Health Metrics
The logger automatically tracks:
- Memory Usage: Heap used, heap total, RSS
- CPU Usage: Average CPU load
- Uptime: Process uptime
- Event Loop Lag: Node.js event loop delay
Automatic Alerts:
⚠️  [Health] High memory usage: 85% (680MB / 800MB)
⚠️  [Health] High CPU usage: 92%
Manual Health Check
const health = this.logger.getHealthMetrics();

console.log(health.memory.heapUsedPercentage);  // 45
console.log(health.cpu.average);                 // 23
console.log(health.uptime);                      // 3600 (seconds)
Query & Export
Query and export logs from in-memory buffer:
Enable Query System
this.logger.configure({
    query: {
        enabled: true,
        bufferSize: 1000,      // Keep last 1000 logs
        enableExport: true
    }
});
Query Logs
By Level
const errors = this.logger.queryLogs({
    level: LogLevel.ERROR
});
By Context
const userServiceLogs = this.logger.queryLogs({
    context: "UserService"
});
By Time Range
const recentLogs = this.logger.queryLogs({
    startTime: Date.now() - 3600000,  // Last hour
    endTime: Date.now()
});
By Search Term
const searchResults = this.logger.queryLogs({
    search: "authentication"
});
By Regex
const matches = this.logger.queryLogs({
    regex: /user-\d+/
});
Chainable Query API
Build complex queries:
const results = this.logger.query()
    .level(LogLevel.ERROR)
    .context("PaymentService")
    .search("timeout")
    .startTime(Date.now() - 3600000)
    .sort("desc")
    .limit(10)
    .execute();
Export to Markdown
const markdown = this.logger.exportLogsToMarkdown({
    query: { level: LogLevel.ERROR },
    title: "Error Logs Report",
    includeStats: true,
    groupBy: "level"
});

// Save to file
fs.writeFileSync("error-report.md", markdown);
Generated Markdown:
# Error Logs Report

## Statistics
- Total Logs: 156
- Errors: 45
- Warnings: 67
- Info: 44

## Errors by Context
### DatabaseService (12 errors)
- 2026-01-10 10:30:45 - Connection timeout
- 2026-01-10 10:32:15 - Query failed
...
Export Options
// Group by level
this.logger.exportLogsToMarkdown({ groupBy: "level" });

// Group by context
this.logger.exportLogsToMarkdown({ groupBy: "context" });

// Filter before export
this.logger.exportLogsToMarkdown({
    query: {
        level: LogLevel.ERROR,
        context: "PaymentService"
    }
});
Statistics
const stats = this.logger.getLogStats();

console.log(stats.total);        // 1000
console.log(stats.byLevel);      // { ERROR: 45, WARN: 67, INFO: 888 }
console.log(stats.byContext);    // { UserService: 234, OrderService: 156, ... }
console.log(stats.oldest);       // timestamp
console.log(stats.newest);       // timestamp
Clear Logs
this.logger.clearLogs();
Request Logging Middleware
Log HTTP requests automatically:
import { createRequestLoggingMiddleware } from "@expressots/adapter-express";

export class App extends AppExpress {
    async configureServices(): Promise<void> {
        const logger = this.Provider.get(Logger);

        this.Middleware.add(
            createRequestLoggingMiddleware(logger, {
                verbosity: "detailed",      // "minimal" | "standard" | "detailed"
                logBody: true,               // Log request body
                logHeaders: false,           // Log headers
                slowRequestThreshold: 1000,  // Warn if request > 1s
                requestIdHeader: "x-request-id",
                correlationIdHeader: "x-correlation-id"
            })
        );
    }
}
Output:
→ GET /api/users/123
  ├─ Request ID: abc-123-def
  ├─ User-Agent: Mozilla/5.0...
  └─ Body: {"filter":"active"}

← 200 GET /api/users/123 (45ms)
  ├─ Request ID: abc-123-def
  └─ Body: {"id":123,"name":"John"}
Backward Compatibility
The legacy logger API still works:
// Legacy API (still supported)
this.logger.info("Message", "ModuleName");
this.logger.warn("Warning", "ModuleName");
this.logger.error("Error", "ModuleName");
this.logger.msg("Message", "ModuleName");

// New API (recommended)
this.logger.info("Message", { userId: 123 });
this.logger.withContext("ModuleName").info("Message");
Best Practices
1. Use Appropriate Log Levels
// ✅ Good
this.logger.debug("User query parameters", { filter: "active" });
this.logger.info("User created", { userId: 123 });
this.logger.warn("Cache miss", { key: "user:123" });
this.logger.error("Database error", error);

// ❌ Bad
this.logger.info("Detailed debug info...");  // Use debug
this.logger.error("Warning message");        // Use warn
2. Include Contextual Data
// ✅ Good
this.logger.error("Payment failed", {
    userId: 123,
    amount: 99.99,
    paymentMethod: "credit_card",
    errorCode: "INSUFFICIENT_FUNDS"
});

// ❌ Bad
this.logger.error("Payment failed");
3. Use Child Loggers for Services
// ✅ Good
export class UserService {
    private logger: Logger;

    constructor(@inject(Logger) logger: Logger) {
        this.logger = logger.child("UserService");
    }

    createUser() {
        this.logger.info("Creating user");  // Auto-includes context
    }
}

// ❌ Bad
this.logger.withContext("UserService").info(...);  // Repetitive
4. Configure Per Environment
// ✅ Good
const config = process.env.NODE_ENV === "production"
    ? {
        level: LogLevel.WARN,
        transports: [
            ConsoleTransport.forProduction(),
            FileTransport.daily({ directory: "logs" })
        ],
        redaction: { enabled: true },
        suggestions: { enabled: false }
    }
    : {
        level: LogLevel.DEBUG,
        transports: [ConsoleTransport.forDevelopment()],
        redaction: { enabled: false },
        suggestions: { enabled: true }
    };

this.logger.configure(config);
5. Handle Errors Properly
// ✅ Good
try {
    await database.connect();
} catch (error) {
    this.logger.error(
        "Database connection failed",
        "DatabaseService",
        error as Error  // Pass full error object
    );
    throw error;
}

// ❌ Bad
catch (error) {
    this.logger.error("Error");  // Missing details
}
Performance Considerations
Memory Usage
- Buffer Size: Default 1000 logs (~1-5MB)
- Circular Buffer: Prevents unbounded growth
- Production: Disable query features to save memory
// Production: Minimal memory usage
this.logger.configure({
    query: { enabled: false },     // Disable buffer
    health: { enabled: true },     // Keep health monitoring
    flow: { enabled: false }       // Disable flow tracking
});
CPU Impact
- Redaction: < 1ms per log entry
- Query: O(n) where n = buffer size
- Export: O(n) where n = logs to export
- Health Monitoring: Minimal (every 30s)
Recommendations
| Environment | Level | Transports | Query | Redaction | Health |
|---|---|---|---|---|---|
| Development | DEBUG | Console (pretty) | ✅ Enabled | ❌ Disabled | ❌ Disabled |
| Staging | INFO | Console + File | ✅ Enabled | ✅ Enabled | ✅ Enabled |
| Production | WARN | File only | ❌ Disabled | ✅ Enabled | ✅ Enabled |
Troubleshooting
Logs Not Appearing
Check log level:
this.logger.configure({ level: LogLevel.TRACE });
Check transports:
this.logger.configure({
    transports: [ConsoleTransport.forDevelopment()]
});
File Transport Not Creating Files
Check directory exists:
mkdir -p logs
chmod 755 logs
Verify configuration:
FileTransport.daily({
    directory: "logs",  // Relative or absolute path
    filename: "app"
})
Redaction Not Working
Enable redaction:
import { configureGlobalRedactor } from "@expressots/core";

configureGlobalRedactor({ enabled: true });
Check patterns:
configureGlobalRedactor({
    enabled: true,
    customFieldPatterns: ["myField"]  // Add custom fields
});
Performance Issues
Disable expensive features in production:
this.logger.configure({
    level: LogLevel.WARN,
    query: { enabled: false },
    flow: { enabled: false },
    suggestions: { enabled: false }
});
Memory Usage High
Reduce buffer size:
this.logger.configure({
    query: {
        enabled: true,
        bufferSize: 100  // Smaller buffer
    }
});
Or disable query entirely:
this.logger.configure({
    query: { enabled: false }
});
API Reference
Logger Methods
| Method | Description |
|---|---|
trace(message, context?, data?) | Log TRACE level |
debug(message, context?, data?) | Log DEBUG level |
info(message, context?, data?) | Log INFO level |
warn(message, context?, data?) | Log WARN level |
error(message, context?, data?) | Log ERROR level |
fatal(message, context?, data?) | Log FATAL level |
withContext(context) | Set temporary context |
child(context) | Create child logger |
configure(options) | Configure logger |
queryLogs(options?) | Query log buffer |
query() | Create chainable query |
getAllLogs() | Get all logs |
getLogStats() | Get statistics |
clearLogs() | Clear log buffer |
exportLogsToMarkdown(options?) | Export to markdown |
getHealthMetrics() | Get health metrics |
getFlowData(requestId) | Get flow data |
Configuration Options
interface LoggerConfig {
    level?: LogLevel | string;
    transports?: Transport[];
    suggestions?: SuggestionsConfig;
    flow?: FlowConfig;
    health?: HealthConfig;
    query?: QueryConfig;
    performance?: PerformanceConfig;
    redaction?: RedactionConfig;
}
Migration from v3
Logger is now injectable
v3:
import console from "console";
console.log("Message");
v4:
@provide(MyService)
export class MyService {
    constructor(@inject(Logger) private logger: Logger) {}

    doSomething() {
        this.logger.info("Message");
    }
}
New log levels
v3: info, warn, error, msg
v4: trace, debug, info, warn, error, fatal (+ legacy methods)
Structured logging
v3:
this.logger.info("User: " + userId + " Email: " + email);
v4:
this.logger.info("User created", { userId, email });
Comparison with Other Frameworks
| Feature | ExpressoTS | NestJS | Fastify |
|---|---|---|---|
| Log Levels | 6 levels | 5 levels | Custom |
| Structured Logging | ✅ Built-in | ✅ Via Winston | ✅ Via Pino |
| Multiple Transports | ✅ Built-in | ✅ Via Winston | ✅ Via Pino |
| Data Redaction | ✅ Automatic | ❌ Manual | ❌ Manual |
| Query & Export | ✅ Built-in | ❌ Not available | ❌ Not available |
| Health Monitoring | ✅ Built-in | ⚠️ Via terminus | ⚠️ Custom |
| Flow Visualization | ✅ Built-in | ❌ Not available | ❌ Not available |
| Error Suggestions | ✅ Built-in | ❌ Not available | ❌ Not available |
Testing Logger
Unit Testing
Test logger in isolation with mocked transports:
describe("LoggerService", () => {
    let logger: Logger;
    let mockTransport: jest.Mocked<Transport>;

    beforeEach(() => {
        mockTransport = {
            write: jest.fn().mockResolvedValue(undefined),
        } as any;

        logger = new Logger();
        logger.configure({
            transports: [mockTransport],
        });
    });

    it("should log info messages", () => {
        logger.info("Test message", { data: 123 });

        expect(mockTransport.write).toHaveBeenCalledWith(
            expect.objectContaining({
                level: "INFO",
                message: "Test message",
            })
        );
    });

    it("should respect log level filtering", () => {
        logger.configure({ level: LogLevel.WARN });

        logger.debug("Debug message"); // Should not log
        logger.warn("Warning message"); // Should log

        expect(mockTransport.write).toHaveBeenCalledTimes(1);
    });
});
Testing Redaction
describe("Data Redaction", () => {
it("should redact sensitive fields", () => {
const capture = captureLogOutput();
logger.info("User login", {
password: "secret123",
});
const log = capture.logs[0];
expect(log).not.toContain("secret123");
expect(log).toContain("••••••••");
});
});
E2E Testing
describe("Logger E2E", () => {
    let app: IWebServerPublic;

    beforeAll(async () => {
        app = await bootstrap(App, { port: 0 });
    });

    afterAll(async () => {
        await app.close();
    });

    it("should log request/response cycle", async () => {
        const capture = captureLogOutput();

        await fetch(`http://localhost:${await app.getPort()}/users`);

        expect(capture.logs).toContainEqual(
            expect.objectContaining({ context: "RequestLogger" })
        );
    });
});
Support the Project
ExpressoTS is MIT-licensed open source. See the support guide to contribute.