Coverage
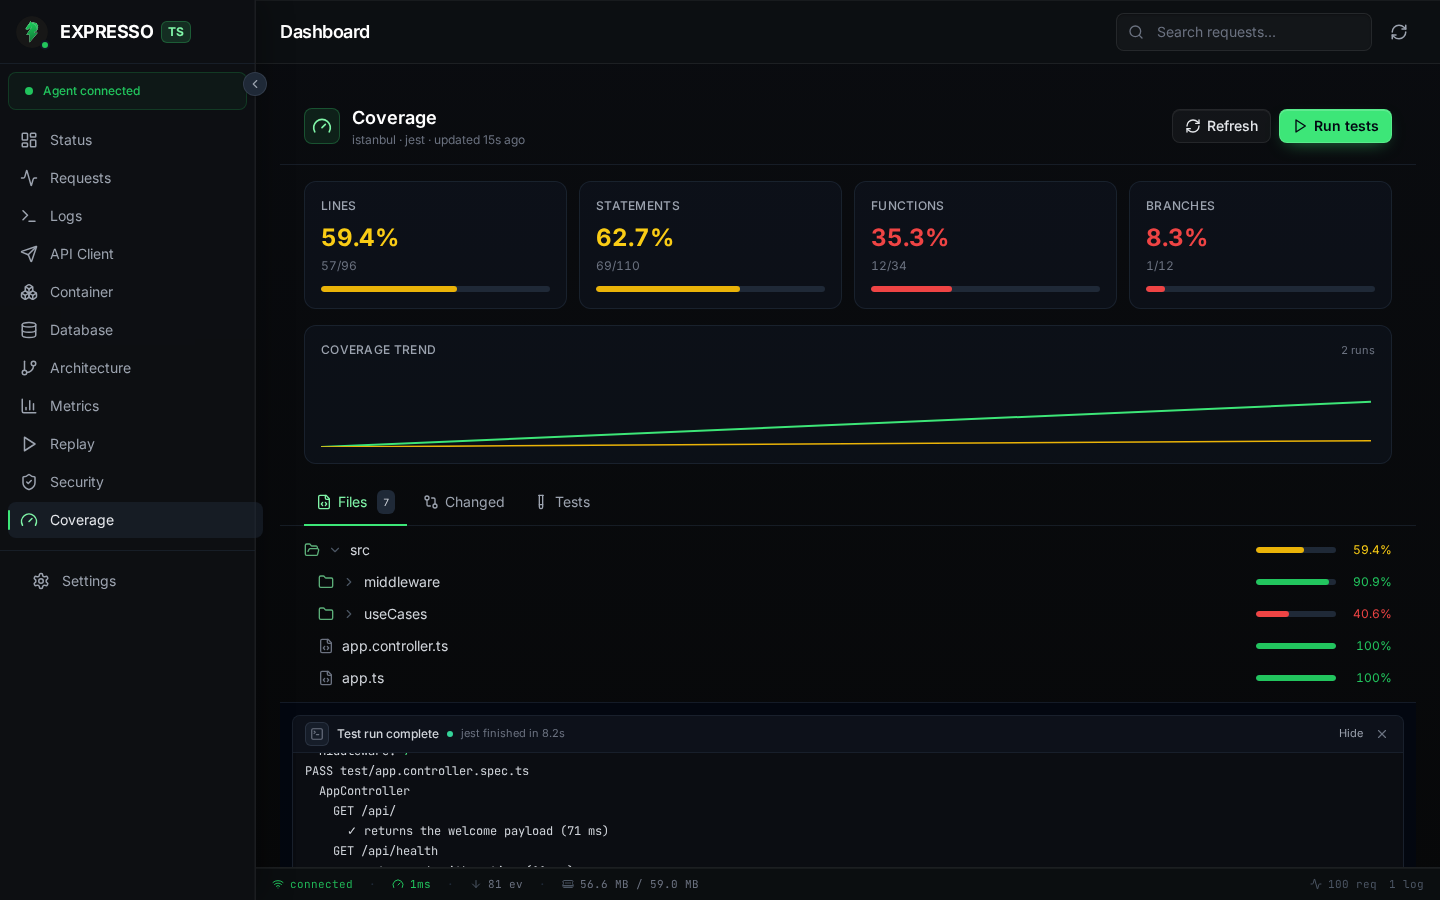
The Coverage view is local, git-aware code coverage intelligence. It watches the coverage artifacts your test runner already produces, normalises them into a single report, and surfaces gaps before you push.
Nothing leaves your machine. Studio parses files on disk under your project root; it never uploads source or coverage data.
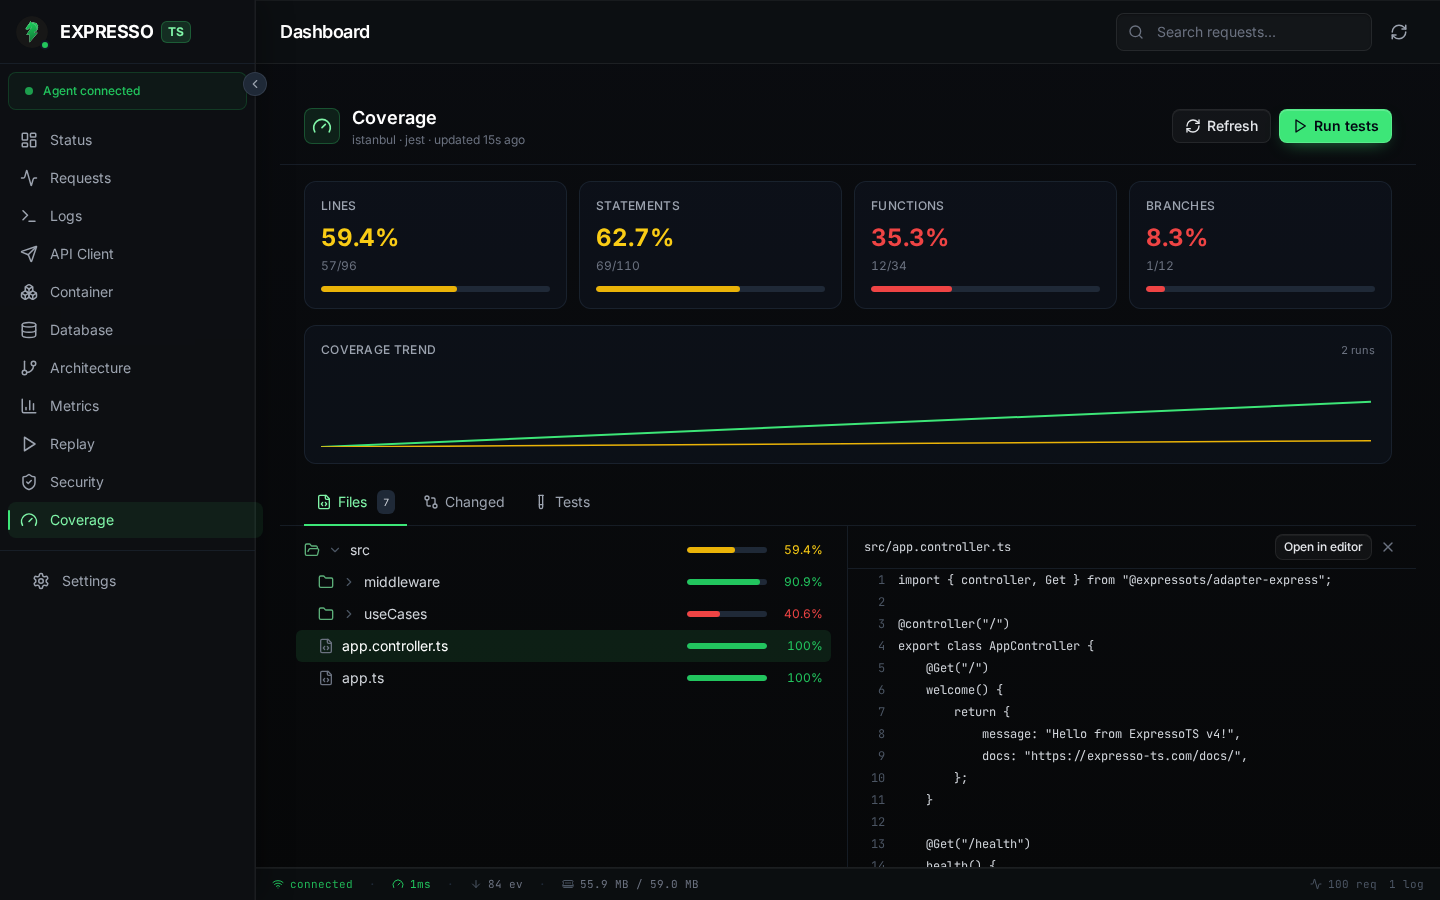
Annotated source
Click any file in the Files tree to open a split-pane source viewer. Covered lines, uncovered lines, and partial branch lines appear as coloured gutters; use Open in editor to jump straight to the file in your IDE.
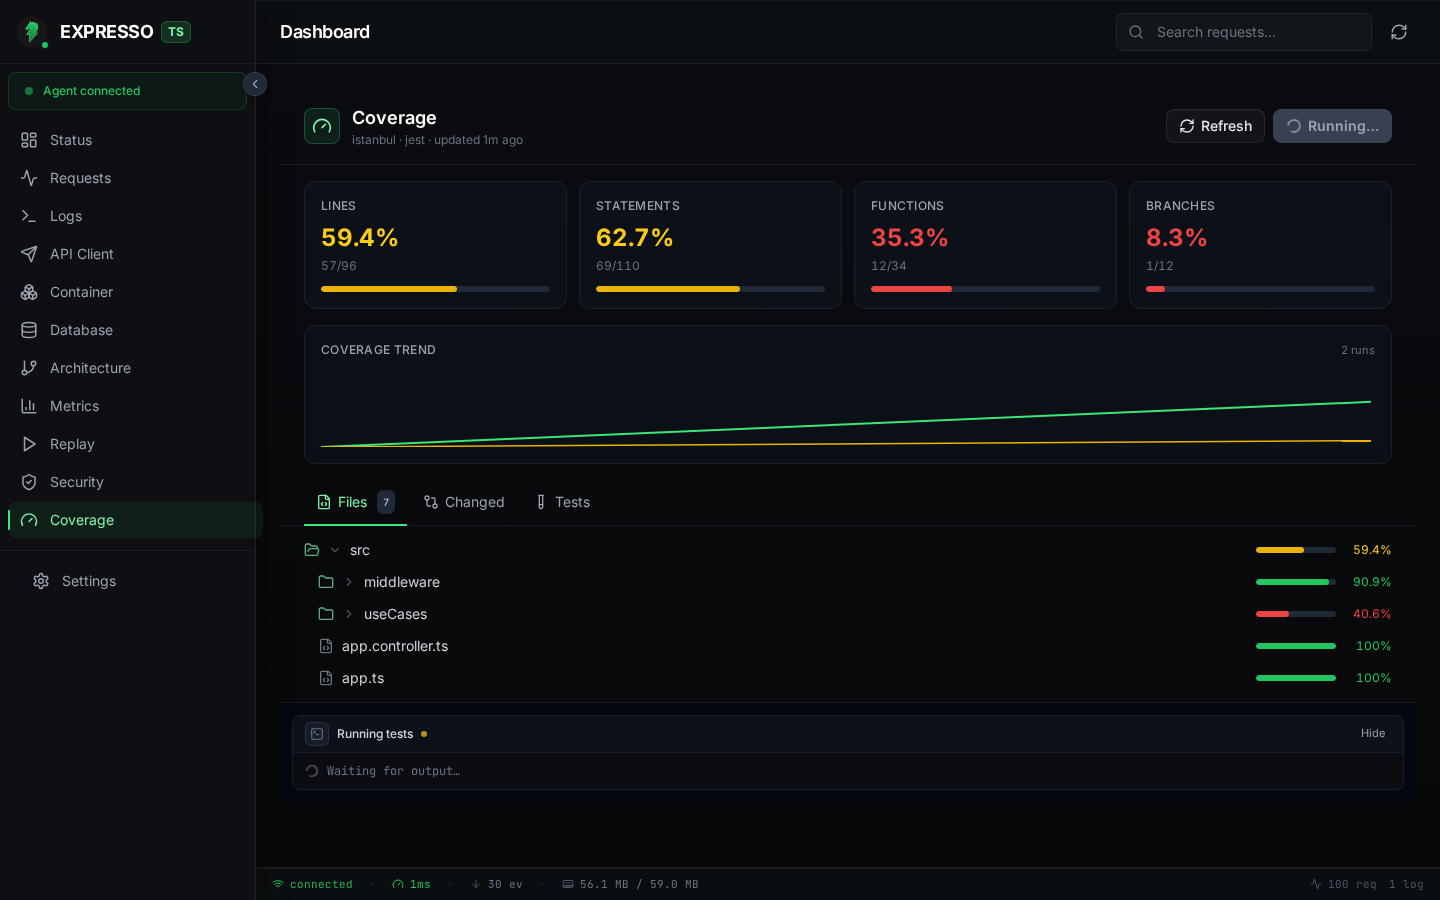
Run tests from Studio
Click Run tests in the Coverage header to invoke your project's detected runner (Jest, Vitest, Mocha, or node:test) with coverage flags. A live terminal transcript streams at the bottom of the view while the run is in flight; when it finishes, summary cards and the file tree refresh automatically.
What you get
- Summary cards for statements, branches, functions, and lines, each with run-over-run delta chips.
- Coverage trend sparkline from recent runs stored in
.studio/studio.db. - Files tab: collapsible, sortable file tree with per-file percentages. Click a file to open an annotated source viewer (covered, uncovered, and partial branch gutters) with one-click Open in editor.
- Changed files tab: git diff coverage against a configurable base ref. See which lines you touched in this branch and whether tests exercise them.
- Tests tab: normalised pass/fail/skip results parsed from JUnit, TAP, or JSON test reports.
- Run tests button: invoke your project's test runner with coverage enabled and stream a live terminal transcript in the UI.
How it works
Studio runs in two modes:
- Watch and parse (passive): the agent watches your
coverage/directory. When a test run finishes and writes a fresh artifact, the engine re-parses automatically. - Run tests (active): click Run tests in the Coverage header and Studio invokes a supported runner with coverage flags, then re-parses the output.
Supported artifact formats (freshest file wins):
| Path | Format |
|---|---|
coverage/coverage-final.json | Istanbul JSON (preferred) |
coverage/lcov.info | LCOV |
coverage/lcov/lcov.info | LCOV |
Custom paths can override this search order (see configuration below).
Supported test runners for the Run tests action:
| Runner | Notes |
|---|---|
vitest | Auto-detected when Vitest is installed |
jest | Auto-detected when Jest is installed |
mocha | Wrapped with c8 for V8 coverage |
node:test | Node built-in test runner (LCOV output) |
When several runners are installed, the button becomes a split control so you can pick which one to run.
Getting started
- Install Studio and start your app in development mode.
- Run your tests with coverage once from the terminal, or click Run tests in the Coverage view.
- Open the Coverage sidebar item. If no artifact exists yet, Studio shows a suggested command rather than a misleading "0%" report.
Example commands that produce compatible artifacts:
# Vitest
npx vitest run --coverage

# Jest
npx jest --coverage

# Mocha (via c8)
npx c8 --reporter=json mocha
Configuration
Create .studio/coverage.json in your project root to override auto-detection:
{
  "runner": "vitest",
  "command": "npm run test:cov",
  "paths": ["packages/api/coverage/coverage-final.json"],
  "diffBase": "origin/main",
  "thresholds": {
    "lines": 80,
    "branches": 70,
    "functions": 80,
    "statements": 80
  }
}
| Field | Purpose |
|---|---|
runner | Force the active-run test runner (vitest, jest, mocha, node:test). |
command | Full shell command for Run tests (e.g. npm run test:cov). Overrides runner. |
paths | Project-root-relative artifact paths searched before the defaults. |
diffBase | Git ref for diff coverage (default: origin/HEAD). |
thresholds | Pass/fail gates (0–100). A badge in the header shows Gates passing or Gates failing. |
Programmatic overrides via setStudio({ coverage: { ... } }) on your App class take precedence over the JSON file.
Threshold gates
When thresholds are configured, the Coverage header shows whether the latest report meets all gates. Use this as a local sanity check during development; wire the same thresholds into CI separately if you want build-time enforcement.
Diff coverage
The Changed files tab compares your working tree against diffBase and highlights:
- Lines you changed that are covered by tests (green gutter).
- Lines you changed that lack coverage (yellow/red gutter).
If the project is not a git repository, or no changes are detected against the base, Studio explains why diff coverage is unavailable instead of showing an empty chart.
Tests tab
Studio looks for machine-readable test output at conventional paths:
junit.xml,test-results.xml,test-report.xmlreports/junit.xml,coverage/junit.xmltest-results.json,reports/test-results.json
When you use Run tests, Studio configures each runner to emit a compatible report alongside the coverage artifact so the Tests tab populates automatically.
Empty and error states
Studio keeps three states visually distinct:
- No artifact yet: instructions and a suggested command (not "0% covered").
- Parsing in progress: spinner on the Refresh button.
- Parse error: a clear message when the artifact exists but could not be read.
Click Refresh to re-parse the latest artifact without re-running tests.