Studio Overview
ExpressoTS Studio is a local developer experience platform that runs alongside your application during development. It records every HTTP request, captures every log line, snapshots your DI graph, scans your dependencies for vulnerabilities, and exposes everything through a single web UI.
Everything runs on your machine. Nothing is sent off the box.
Why Studio
In v3, the framework gave you a black-box app.listen(). In v4, the framework already exposes a richer runtime (AppContainer.introspect(), lifecycle hooks, structured logger, interceptors). Studio is the interactive surface for all of that runtime data.
| Without Studio | With Studio |
|---|---|
console.log until you find the failing request | Click a request in the Timeline, see the full trace, body, headers, and stack |
Run npm audit once a sprint | Live security dashboard with reachability scoring and one-click fixes |
| Guess which routes are slow | Per-route P50/P95/P99 and error rate from real traffic |
Mentally rebuild the DI graph from provide() calls | Architecture Map auto-generated from AppContainer.introspect() |
Reproduce a bug with curl and a notes file | Replay any recorded request and diff the new response |
Architecture
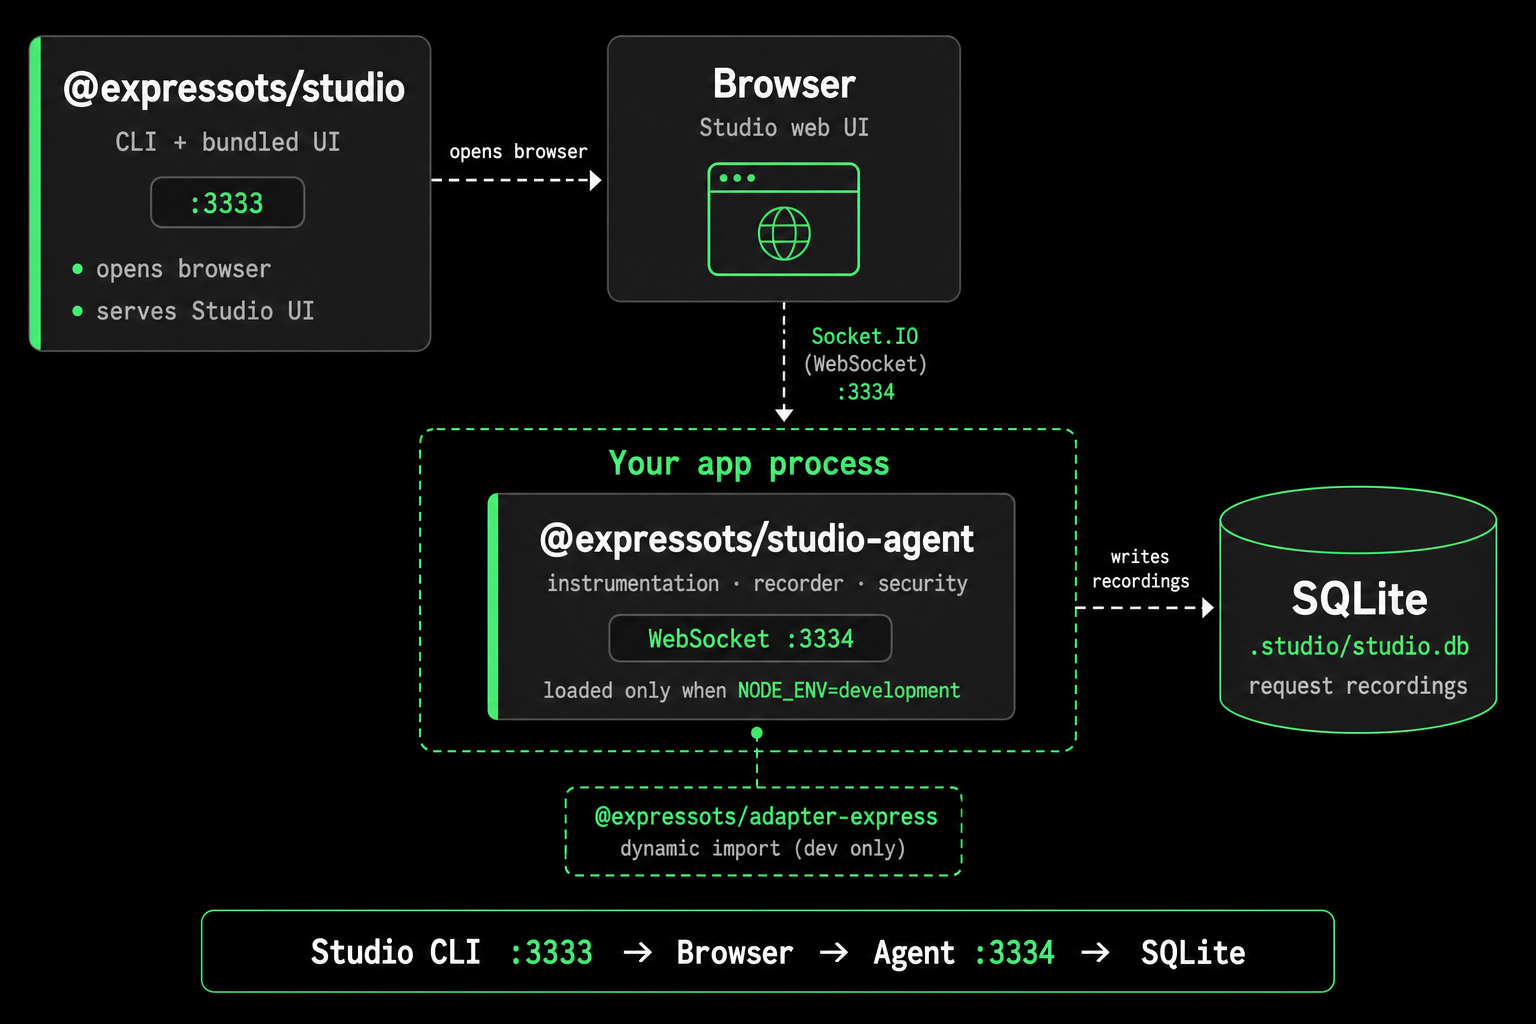
Studio is split into two publishable packages plus a local database so production builds stay lean. The CLI boots the UI; the agent lives inside your app and streams data over WebSocket; recordings persist to SQLite on disk.

| Package | Where it runs | What it does |
|---|---|---|
@expressots/studio | Standalone dev process | Boots the Web UI, probes the agent, opens the browser, owns the CLI. |
@expressots/studio-agent | Inside your app process | Instrumentation middleware, SQLite recorder, log capture, DI snapshot, security engine, WebSocket server. |
@expressots/adapter-express dynamically imports @expressots/studio-agent only when it is installed and NODE_ENV=development, so production deployments never load the agent code and never pay the runtime cost.
What you can do in Studio
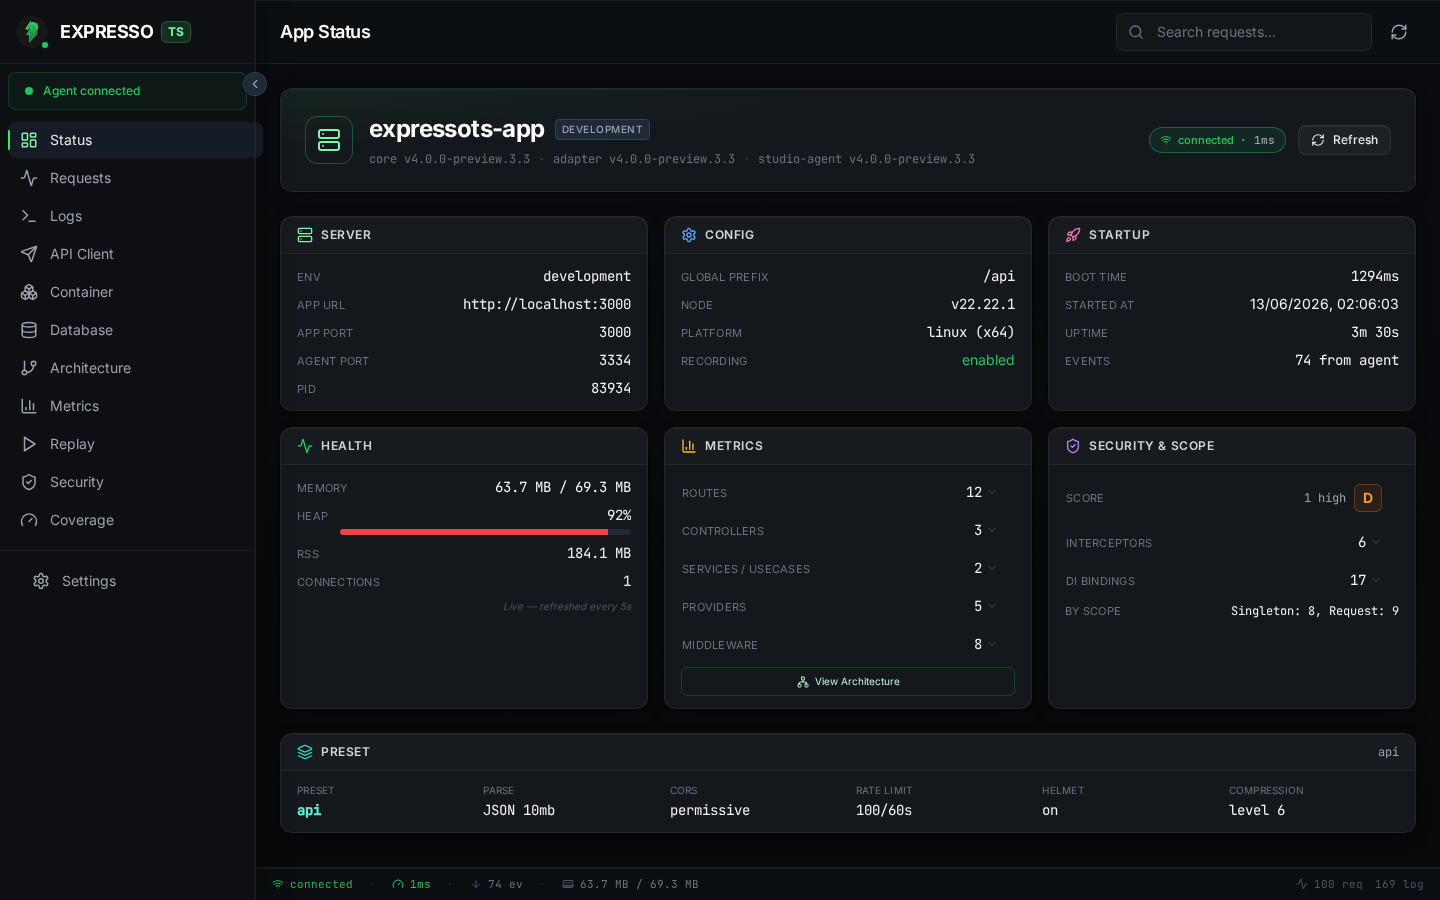
Studio opens at http://localhost:3333 once you run npx expressots-studio with your app already in dev mode. The sidebar groups every capability below. All views update live over Socket.IO while traffic flows through your app.
Status: your at-a-glance command center
The Status view is the landing screen when Studio connects. Use it to answer "is my app healthy right now?" without digging through logs.
- See process uptime, memory, and the ExpressoTS version your app is running.
- Review DI scope counts (how many singleton, request, and transient bindings are registered).
- Spot your slowest routes and error rates from real recorded traffic, not synthetic probes.
- Jump to the Security view from the aggregate letter grade (A to F) when supply-chain or runtime posture needs attention.
Requests: record, inspect, and replay every HTTP call
The Requests view is a live timeline of every HTTP exchange the agent captured to .studio/studio.db.
- Filter and search by path fragment or HTTP method; pause auto-scroll while you read a long trace.
- Open any row to see Trace Detail: OpenTelemetry spans, request/response headers and bodies, status code, and timing breakdown.
- Replay a recorded request against your still-running app and diff the new response against the original, ideal for reproducing bugs without rewriting
curlcommands. - Clear or snapshot the recording buffer when you want a clean slate before a focused test run.
Errors surfaced during requests also feed the error inspector (stack frames with openInEditor deep-links when your editor supports it).
Logs: every framework and app log line in one place
The Logs view streams the in-memory log buffer the agent collects from ExpressoTS and your application code.
- Filter by level (
TRACEthroughFATAL), route, or logger context. - Follow a single request's log trail after selecting it in the timeline.
- Export a Markdown report when you need to attach evidence to a ticket or PR.
No more grepping terminal output across three restart cycles.
API Client: send requests without leaving Studio
The API Client is a built-in HTTP client aimed at your running app.
- Compose method, URL, headers, query string, and body in one panel.
- Fire the request and read status, headers, and body from the live response pane.
- Use it to smoke-test an endpoint while you watch the same call appear seconds later in Requests and Logs.
Handy when you want to trigger traffic deliberately for architecture or security analysis.
Container: inspect the DI graph binding-by-binding
The Container view shows the DI snapshot the agent captured at startup (and highlights bindings resolved for a selected request).
- Browse a filterable table of every binding: identifier, implementation, and scope (
Singleton,Request,Transient). - Switch to an interactive dependency graph (React Flow) to see how controllers, use cases, and providers connect.
- When a request is selected in Requests, the graph emphasizes which services participated in that call.
Use this when onboarding to an unfamiliar codebase or verifying that a new provide() registration landed in the right scope.
Architecture: see how controllers, use cases, and providers connect
The Architecture view renders a read-only map from AppContainer.introspect(), the same metadata the framework uses internally.
- Controllers, use cases, providers, and middleware appear as nodes with DI scope badges.
- Active paths highlight as requests flow, so you can see which slice of the graph your traffic actually exercises.
- Complements Container (binding-level detail) with a higher-level structural map of the application.
Database: browse your in-memory provider
If your app registers the v4 InMemoryDBProvider, the Database view becomes a read-only data browser.
- List every entity table with live record counts.
- Inspect field schemas (keys, unique constraints, indexes) and relations (
hasOne,hasMany,belongsTo,manyToMany). - Page through rows (50 per page) without writing ad-hoc scripts.
When no in-memory provider is registered, Studio shows a friendly empty state with the exact configureServices() wiring you need.
Metrics: latency and throughput from real traffic
The Metrics dashboard aggregates performance data from recorded exchanges.
- Per-route P50, P95, and P99 latency.
- Error rates and request volume over time.
- Identify regressions after a refactor by comparing routes you exercise in dev, not guesses from a single
curltiming.
Replay: batch re-run recorded exchanges
The dedicated Replay view focuses on re-executing past requests.
- Pick any recorded exchange and replay it against the current code.
- Review side-by-side diffs (status, headers, body) when the replay diverges, for example after you change validation or auth.
- Tune diff filters from the Settings drawer (ignore headers you expect to change, such as
DateorETag).
Pair with Requests when you need full trace context; use Replay when you are iterating on response shape.
Security: supply chain and runtime posture in one place
The Security view is a local, always-on security analyst for your application. It combines two complementary lenses so you catch vulnerabilities during development, not in production.
Studio never sends your package.json, lockfile, code, or traffic anywhere. All analysis happens on your machine.
Why it matters
Most teams run npm audit once a sprint and ignore the results because the list is noisy and mostly transitive. Studio solves that with reachability scoring: it cross-references advisories against your actual imports, DI graph, and recorded traffic so you know which vulnerabilities your code actually reaches.
Supply-chain analysis
When you open the Security view (or whenever the lockfile changes), the agent:
- Runs
npm audit --jsonin a background child process (never on the request thread). - Cross-references results against OSV.dev for richer metadata and non-npm advisories.
- Parses your lockfile into a dependency graph to build root-cause chains that show which direct dependency dragged in the vulnerable transitive package.
- Scores each finding for reachability:
| Reachability | Meaning |
|---|---|
confirmed | A recorded exchange hit a route whose source transitively imports the vulnerable package. |
likely | A route imports the package, but no recorded exchange has hit that route yet. |
unreachable | The package is in the lockfile but no source file in src/ imports it (e.g. dev-only transitive). |
unknown | Recording is disabled or the source scan timed out. |
Each advisory shows severity, package and version, GHSA/CVE/OSV links, the root-cause chain, and a copy-pasteable fix command.
One-click fixes
Findings that share an upgrade target are grouped into FixGroups. Click Apply fix and Studio runs the command, streams live terminal output, and automatically re-scans when it finishes, with no manual npm audit cycle needed.
Runtime posture (OWASP API Top 10)
Beyond dependencies, Studio scores your recorded HTTP traffic, routes, logs, and DI graph against the OWASP API Security Top 10:
- BOLA: routes with
:idparams that respond without an auth guard. - Broken Authentication: sensitive routes hit without an
Authorizationheader. - Excessive Data Exposure: response bodies leaking
password,apiKey,tokenfields. - Unrestricted Resource Use: routes responding > 2 s with no
TimeoutInterceptor. - Server-Side Misconfig: CORS
*, missing helmet, and similar middleware gaps. - Injection: error logs containing raw SQL or shell exception patterns.
- Improper Inventory: source-scanned routes that never appear in recordings (zombie routes).
Posture findings are heuristic. They are a valuable development-time second opinion, not a replacement for a formal security review.
Aggregate score
Both pillars feed a single letter grade (A–F) on the Status dashboard. unreachable findings count at ⅕ weight, so a clean codebase with only dev-only transitive advisories still scores an A.
Settings and keyboard shortcuts
Open Settings from the sidebar footer to tune how Studio behaves:
- Switch light/dark theme.
- Cap how many exchanges are retained in memory and on disk.
- Configure replay diff ignore rules.
- View keyboard shortcuts (
?toggles the shortcuts overlay).
Performance posture
Studio is built to disappear in production and stay out of the hot path in development:
- Production builds: the studio-agent module is never imported because
NODE_ENV !== "development". There is zero overhead, zero added port, zero file I/O. - Recording: writes to a local SQLite file (
.studio/studio.db) via prepared statements; writes are batched and never block the request thread. - Security scans:
npm auditruns as an async child process; results are cached on disk; the engine re-runs only when the lockfile changes or a fix completes. - Logs / metrics: kept in a bounded in-memory ring buffer; oldest entries are dropped first.
- UI broadcasts: every frame is debounced and only emitted when at least one client is connected.
See Installation to add Studio to an existing project.