Metrics
The Metrics dashboard aggregates live performance data from your running application, giving you a complete picture of throughput, latency, errors, memory, and per-route behaviour from real traffic.
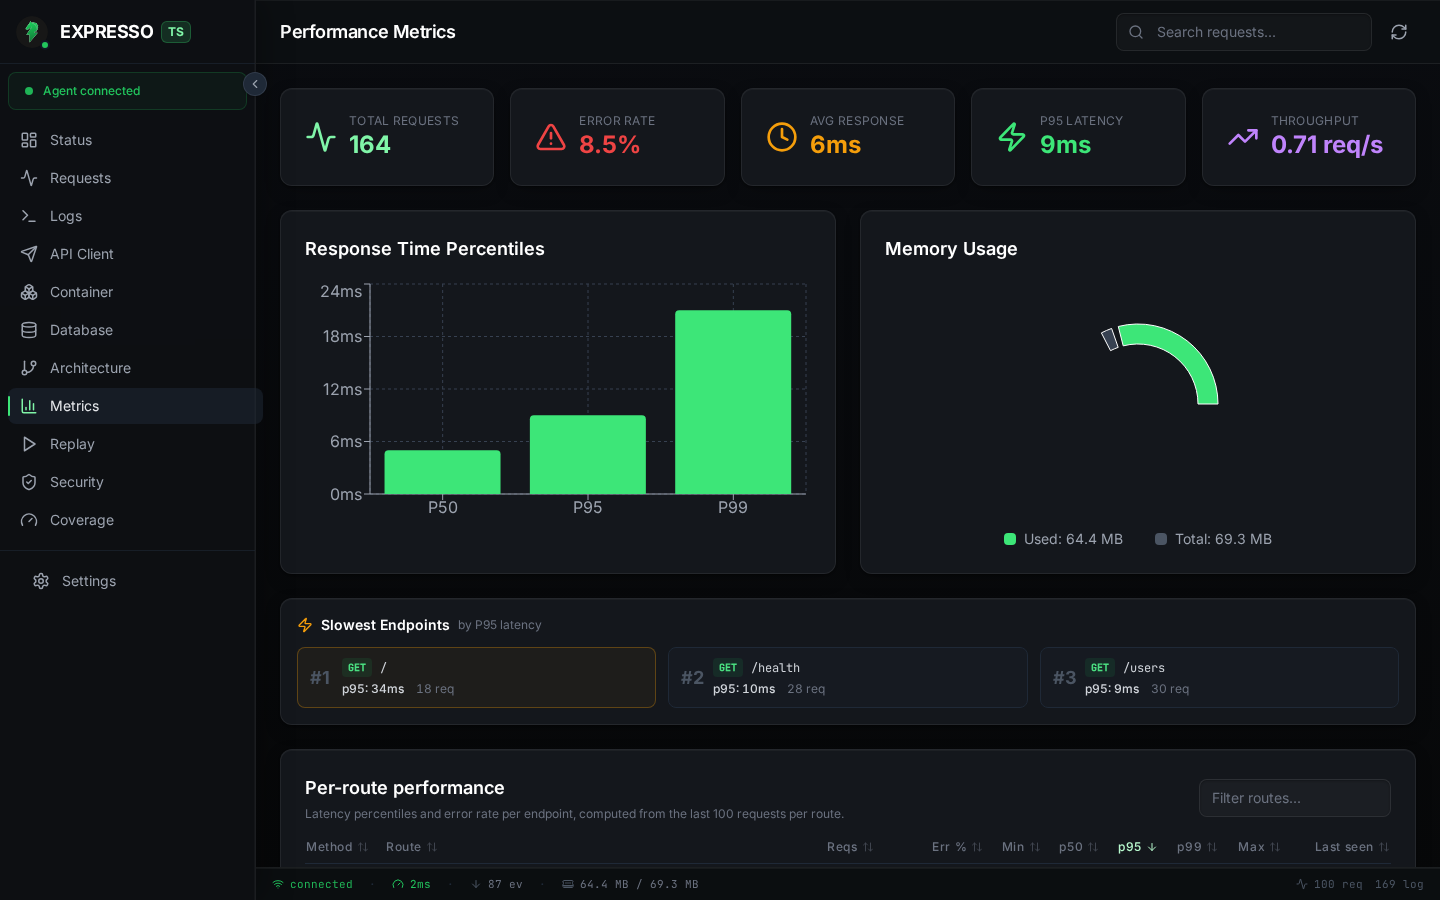
Summary cards
Five cards at the top give you the key numbers at a glance:
| Card | What it shows |
|---|---|
| Total Requests | Cumulative request count since the app started (or since the last clear). |
| Error Rate | Percentage of requests that returned an error status. Turns red above 5%. |
| Avg Response | Average response time across all recorded requests. |
| P95 Latency | 95th-percentile response time, the tail latency most users experience. |
| Throughput | Requests per second computed from total requests divided by uptime. |
Response Time Percentiles
A bar chart showing P50, P95, and P99 latency side by side. Use this to spot whether your tail latency (P99) is significantly worse than median (P50), which typically indicates intermittent slow paths or resource contention.
Memory Usage
A donut chart breaking down heap used vs. total heap. The legend shows exact byte counts. Watch for the "used" segment approaching "total" during development to catch memory leaks before they reach production.
Slowest Endpoints
A highlight strip above the full route table surfaces the top 3 endpoints by P95 latency. This answers "where is my bottleneck?" without scrolling through a large table. The slowest route gets a warning-coloured border for visual emphasis. Each entry shows the HTTP method, path, P95 value, and request count.
Per-route performance table
The full route table breaks down every endpoint the agent has recorded:
| Column | Description |
|---|---|
| Method | HTTP verb (colour-coded badge). |
| Route | Request path. |
| Reqs | Total request count for that route. |
| Err % | Error rate with error count in parentheses when non-zero. |
| Min | Minimum observed latency. Helps distinguish cold-start from steady-state performance. |
| P50 | Median latency. |
| P95 | 95th-percentile latency (default sort column). |
| P99 | 99th-percentile latency. |
| Max | Maximum observed latency. |
| Last seen | Relative timestamp of the most recent request to that route (e.g. "3s ago", "2m ago"). |
Every column header is sortable. A search box filters routes by method or path. Latency cells are colour-coded: green below 200ms, amber between 200-500ms, and red above 500ms.
Percentiles are computed from the last 100 requests per route, so values stabilize quickly even during a short development session.
System info
Three cards below the route table report low-level runtime data:
- RSS Memory: resident set size of the Node.js process.
- Active Connections: number of currently open WebSocket clients.
- Uptime: how long the application has been running.
How data flows
The agent middleware records every HTTP request as it completes. Duration, status, method, and path are captured and fed into the metrics aggregator. Percentiles are recalculated on a 5-second interval. Clearing recordings (from the Requests view) also resets all metric counters and percentiles so you start from a clean slate.
Metrics populate after traffic hits your app. Use the API Client or your integration tests during development to build a representative sample.